|
|
| |
|
|
| |
|
|
|
|
| |
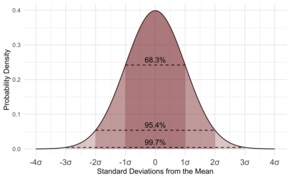 |
| The normal
distribution, a very common probability density,
useful because of the central limit theorem. |
Statistics
Statistics is the science of data. It enables the
collection, analysis, understanding, and presentation of
data. It helps in the study of many other fields, such
as medicine, economics, psychology, and marketing.
Someone who works in statistics is called a
statistician.
Statistics provides ways to get the data needed for a
study without waste, such as surveys and controlled
experiments. Once the data has been collected, there are
two basic ways that data can be analyzed: |
- First, statistics can help describe
the data. This is known as descriptive statistics.
Descriptive statistics is about finding meaningful ways
to summarize the data, because it is easier to use the
"summary" than having to use the whole set of data all
the time. Summarizing the data also allows to find
common patterns. In statistics, such patterns are called
probability distributions. The basic idea is to look at
the results of an experiment, and look at how the
results are grouped.
- Once the results have been
summarized and described they can be used for
prediction. This is called Inferential Statistics. As an
example, the size of an animal is dependent on many
factors. Some of these factors are controlled by the
environment, but others are by inheritance. A biologist
might therefore make a model that says that there's a
high probability, the offspring will be small in size if
the parents were small in size. This model probably
allows to predict the size in better ways than by just
guessing at random. Testing whether a certain drug can
be used to cure a certain condition or disease is
usually done by comparing the results of people who are
given the drug against those of people who are given a
placebo.
|
|
History
Statistics have been in use for a long time. The first
known statistics are census data. The Babylonians did a
census around 3500BC, the Egyptians around 2500 BC, and
the Ancient Chinese around 1000 BC.
Collecting data
Before we can describe the world with statistics, we
must collect data. The data that we collect in
statistics are called measurements. After we collect
data, we use one or more numbers to describe each
observation or measurement. For example, suppose we want
to find out how popular a certain TV show is. We can
pick a group of people (called a sample) out of the
total population of viewers. Then we ask each one how
often they watch the show, or (better) we measure it by
attaching a counter to each of their television sets.
For another example, if we want to know whether a
certain drug can help lower blood pressure, we could
give the drug to people for some time and measure their
blood pressure before and after.
Methods
Most often we collect statistical data by doing surveys
or experiments. To do a survey, we pick a small number
of people and ask them questions. Then, we use their
answers as the data.
The choice of which individuals to take for a survey or
data collection is important, as it directly influences
the statistics. When the statistics are done, it can no
longer be determined which individuals are taken.
Suppose we want to measure the water quality of a big
lake. If we take samples next to the waste drain, we
will get different results than if the samples are taken
in a far away, hard to reach, spot of the lake.
There are two kinds of problems which are commonly found
when taking samples: |
- If there are many samples, the
samples will likely be very close to what they are in
the real population. If there are very few samples,
however, they might be very different from what they are
in the real population. This error is called a chance
error (see Errors and residuals in statistics).
- The individuals for the samples need
to be chosen carefully, usually they will be chosen
randomly. If this is not the case, the samples might be
very different from what they really are in the total
population. This is true even if a great number of
samples is taken. This kind of error is called bias.
|
Errors
We can reduce chance errors by taking a larger sample, and
we can avoid some bias by choosing randomly. However,
sometimes large random samples are hard to take. And bias
can happen if different people are not asked, or refuse to
answer our questions, or if they know they are getting a
fake treatment. These problems can be hard to fix. See also
standard error. |
|
Descriptive statistics
The middle of the data is called an average. The average
tells us about a typical individual in the population.
There are three kinds of average that are often used:
the mean, the median and the mode.
Mean
The mean is adding up all the values and then dividing
by the number of values.
The problem with the mean is that it does not tell
anything about how the values are distributed. Values
that are very large or very small change the mean a lot.
In statistics, these extreme values might be errors of
measurement, but sometimes the population really does
contain these values. For example, if in a room there
are 10 people who make $10/day and 1 who makes
$1,000,000/day. The mean of the data is $90,918/day.
Even though it is the average amount, the mean in this
case is not the amount any single person makes, and is
probably useless.
Median
The median is the middle item of the data. To find the
median we sort the data from the smallest number to the
largest number and then choose the number in the middle.
If there is an even number of data, there will not be a
number right in the middle, so we choose the two middle
ones and calculate their mean. In our example there are
10 items of data, the two middle ones are "57" and "64",
so the median is (57+64)/2 = 60.5. Another example, like
the income example presented for the mean, consider a
room with 10 people who have incomes of $10, $20, $20,
$40, $50, $60, $90, $90, $90, $100, and $1,000,000, the
median is $55 because $55 is the average of the two
middle numbers, $50 and $60. If the extreme value of
$1,000,000 is ignored, the mean is $57. In this case,
the median is close to the value obtained when the
extreme value is thrown out. The median solves the
problem of extreme values as described in the definition
of mean above.
Mode
The mode is the most frequent item of data. For example
the most common letter in English is the letter "e". We
would say that "e" is the mode of the distribution of
the letters.
For example, if in a room there are 10 people with
incomes of $10, $20, $20, $40, $50, $60, $90, $90, $90,
$100, and $1,000,000, the mode is $90 because $90 occurs
three times and all other values occur fewer than three
times.
There can be more than one mode. For example, if in a
room there are 10 people with incomes of $10, $20, $20,
$20, $50, $60, $90, $90, $90, $100, and $1,000,000, the
modes are $20 and $90. This is bi-modal, or has two
modes. Bi-modality is very common and often indicates
that the data is the combination of two different
groups. For instance, the average height of all adults
in the U.S. has a bi-modal distribution. This is because
males and females have separate average heights of 1.763
m (5 ft 9 + 1⁄2 in) for men and 1.622 m (5 ft 4 in) for
women. These peaks are apparent when both groups are
combined.
The mode is the only form of average that can be used
for data that can not be put in order. |
|
Finding the spread of the
data
Another thing we can say about a set of data is how
spread out it is. A common way to describe the spread of
a set of data is the standard deviation. If the standard
deviation of a set of data is small, then most of the
data is very close to the average. If the standard
deviation is large, though, then a lot of the data is
very different from the average.
If the data follows the common pattern called the normal
distribution, then it is very useful to know the
standard deviation. If the data follows this pattern (we
would say the data is normally distributed), about 68 of
every 100 pieces of data will be off the average by less
than the standard deviation. Not only that, but about 95
of every 100 measurements will be off the average by
less that two times the standard deviation, and about
997 in 1000 will be closer to the average than three
standard deviations.
Other descriptive statistics
We also can use statistics to find out that some
percent, percentile, number, or fraction of people or
things in a group do something or fit in a certain
category.
For example, social scientists used statistics to find
out that 49% of people in the world are males. |
|
 Kiddle: Statistics Kiddle: Statistics
Wikipedia: Statistics |
|
|
|
|
|
|
|
|
|
|
|
|
|
|
|
|
Search Fun Easy English |
|
|
|
|
|
|
|
|
|
|
|
|
|
|
|
About
Contact
Copyright
Resources
Site Map |