|
|
| |
|
|
| |
|
|
|
|
| |
 Climate
Change Indicators: Ecosystems Climate
Change Indicators: Ecosystems
Ecosystems provide humans with food, clean water, and a
variety of other services that can be affected by climate
change. This chapter looks at some of the ways that climate
change affects ecosystems, including changes in wildfires,
streams and lakes, bird migration patterns, fish and
shellfish populations, and plant growth. |
|
Climate Changes
Changes in the Earth’s climate can affect ecosystems by
altering the water cycle, habitats, animal behavior—such as
nesting and migration patterns—and the timing of natural
processes such as flower blooms. Changes that disrupt the
functioning of ecosystems may increase the risk of harm or
even extinction for some species. While wildfires occur
naturally, more frequent and more intense fires can
significantly disrupt ecosystems, damage property, put
people and communities at risk, and create air pollution
problems even far away from the source.
While plants and animals have adapted to environmental
change for millions of years, the climate changes being
experienced now could require adaptation on larger and
faster scales than current species have successfully
achieved in the past, thus increasing the risk of extinction
or severe disruption for many species. |
|
|
Summary of Key Points |
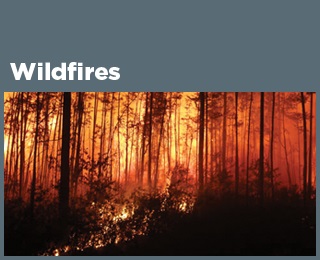 Wildfires
- Since 1983, the United States has had an average of 72,000
recorded wildfires per year. Of the 10 years with the
largest acreage burned since 1983, nine have occurred since
2000 with many of the largest increases occurring in western
states. The proportion of burned land suffering severe
damage each year has ranged from 5 to 21 percent. Wildfires
- Since 1983, the United States has had an average of 72,000
recorded wildfires per year. Of the 10 years with the
largest acreage burned since 1983, nine have occurred since
2000 with many of the largest increases occurring in western
states. The proportion of burned land suffering severe
damage each year has ranged from 5 to 21 percent. |
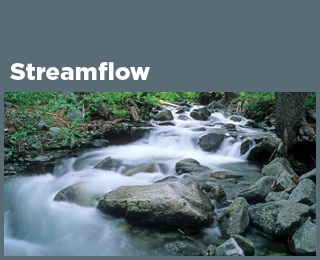 Streamflow
- Changes in temperature, precipitation, snowpack, and
glaciers can affect the rate of streamflow and the timing of
peak flow. Over the last 75 years, minimum, maximum, and
average flows have changed in many parts of the country—some
higher, some lower. Most of the rivers and streams measured
show peak winter-spring runoff happening at least five days
earlier than it did in the mid-20th century. Streamflow
- Changes in temperature, precipitation, snowpack, and
glaciers can affect the rate of streamflow and the timing of
peak flow. Over the last 75 years, minimum, maximum, and
average flows have changed in many parts of the country—some
higher, some lower. Most of the rivers and streams measured
show peak winter-spring runoff happening at least five days
earlier than it did in the mid-20th century. |
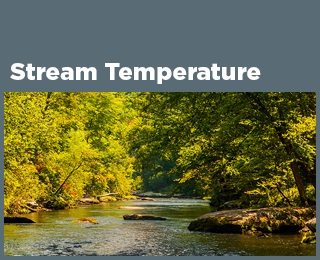 Stream
Temperature - Stream temperatures have risen throughout
the Chesapeake Bay region—the area of focus for this
indicator. From 1960 through 2014, water temperature
increased at 79 percent of the stream sites measured in the
region. Temperature has risen by an average of 1.2°F across
all sites and 2.2°F at the sites where trends were
statistically significant. Stream
Temperature - Stream temperatures have risen throughout
the Chesapeake Bay region—the area of focus for this
indicator. From 1960 through 2014, water temperature
increased at 79 percent of the stream sites measured in the
region. Temperature has risen by an average of 1.2°F across
all sites and 2.2°F at the sites where trends were
statistically significant. |
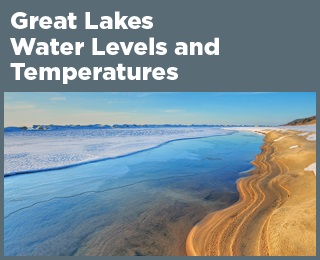 Great
Lakes Water Levels - Water levels in most of the Great
Lakes appear to have declined in the last few decades.
However, the most recent levels are all within the range of
historical variation. Water levels in lakes are influenced
by water temperature, which affects evaporation rates and
ice formation. Since 1995, average surface water
temperatures have increased slightly for each of the Great
Lakes. Great
Lakes Water Levels - Water levels in most of the Great
Lakes appear to have declined in the last few decades.
However, the most recent levels are all within the range of
historical variation. Water levels in lakes are influenced
by water temperature, which affects evaporation rates and
ice formation. Since 1995, average surface water
temperatures have increased slightly for each of the Great
Lakes. |
 Bird
Wintering Ranges - Some birds shift their range or alter
their migration habits to adapt to changes in temperature or
other environmental conditions. Long-term studies have found
that bird species in North America have shifted their
wintering grounds northward by an average of more than 40
miles since 1966, with several species shifting by hundreds
of miles. On average, bird species have also moved their
wintering grounds farther from the coast, consistent with
inland winter temperatures becoming less severe. Bird
Wintering Ranges - Some birds shift their range or alter
their migration habits to adapt to changes in temperature or
other environmental conditions. Long-term studies have found
that bird species in North America have shifted their
wintering grounds northward by an average of more than 40
miles since 1966, with several species shifting by hundreds
of miles. On average, bird species have also moved their
wintering grounds farther from the coast, consistent with
inland winter temperatures becoming less severe. |
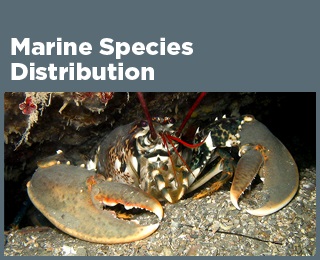 Marine
Species Distribution - The average center of biomass for
105 marine fish and invertebrate species along U.S. coasts
shifted northward by about 10 miles between 1982 and 2015.
These species also moved an average of 20 feet deeper.
Shifts have occurred among several economically important
fish and shellfish species. For example, American lobster,
black sea bass, and red hake in the Northeast have moved
northward by an average of 119 miles. Marine
Species Distribution - The average center of biomass for
105 marine fish and invertebrate species along U.S. coasts
shifted northward by about 10 miles between 1982 and 2015.
These species also moved an average of 20 feet deeper.
Shifts have occurred among several economically important
fish and shellfish species. For example, American lobster,
black sea bass, and red hake in the Northeast have moved
northward by an average of 119 miles. |
 Leaf
and Bloom Dates - Leaf growth and flower blooms are
examples of natural events whose timing can be influenced by
climate change. Observations of lilacs and honeysuckles in
the contiguous 48 states suggest that first leaf dates and
bloom dates show a great deal of year-to-year variability.
Leaf and bloom events are generally happening earlier
throughout the North and West but later in much of the
South. Leaf
and Bloom Dates - Leaf growth and flower blooms are
examples of natural events whose timing can be influenced by
climate change. Observations of lilacs and honeysuckles in
the contiguous 48 states suggest that first leaf dates and
bloom dates show a great deal of year-to-year variability.
Leaf and bloom events are generally happening earlier
throughout the North and West but later in much of the
South. |
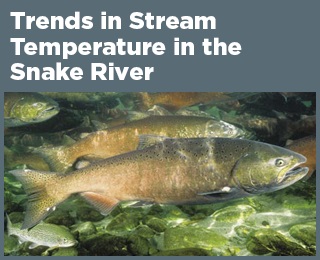 Tribal
Connection: Trends in Stream Temperature in the Snake River
- Between 1960 and 2015, water temperatures increased by
1.4°F in the Snake River at a site in eastern Washington.
Several species of salmon use the Snake River to migrate and
spawn, and these salmon play an important role in the diet,
culture, religion, and economy of the region’s Native
Americans. Tribal
Connection: Trends in Stream Temperature in the Snake River
- Between 1960 and 2015, water temperatures increased by
1.4°F in the Snake River at a site in eastern Washington.
Several species of salmon use the Snake River to migrate and
spawn, and these salmon play an important role in the diet,
culture, religion, and economy of the region’s Native
Americans. |
 Community
Connection: Cherry Blossom Bloom Dates in Washington, D.C.
- Peak bloom dates of the iconic cherry trees in Washington,
D.C., recorded since the 1920s, indicate that cherry trees
are blooming slightly earlier than in the past. Bloom dates
are key to planning the Cherry Blossom Festival, one of the
region’s most popular spring attractions. Community
Connection: Cherry Blossom Bloom Dates in Washington, D.C.
- Peak bloom dates of the iconic cherry trees in Washington,
D.C., recorded since the 1920s, indicate that cherry trees
are blooming slightly earlier than in the past. Bloom dates
are key to planning the Cherry Blossom Festival, one of the
region’s most popular spring attractions. |
|
|
|
|
EPA Page |
|
This is the
EPA page for this topic. To see if the Trump
administration has changed the EPA page, simply click the
link and compare the information with this page. If you
notice changes were made to the EPA page, please post a
comment. Thanks. |
|
|
|
|
|
|
|
|
|
|
|
|
Additional Climate Change Information |
Climate Change and Carbon Dioxide
(Beginner - Listening,
reading)
A video lesson to
help with your understanding of climate change
and carbon dioxide.
The English is
spoken at 75% of normal speed.
Great English listening and reading practice. |
Carbon Dioxide and Climate Change
(Beginner - Listening,
reading)
A video lesson to
help with your understanding of carbon dioxide
and climate change.
The English is
spoken at 75% of normal speed.
Great English listening and reading practice. |
Environmental Group Warns Earth's Health at Risk
(Beginner - Listening,
reading)
A video lesson to
help with your understanding of climate change.
The English is
spoken at 75% of normal speed.
Great English listening and reading practice.
A report by the World Wildlife Fund looked at thousands of animal populations
and found they have dropped significantly in 40 years. |
Sea Levels Rising at Fastest Rate in 3,000 years
(Beginner - Listening,
reading)
A video lesson to
help with your understanding of climate change.
The English is
spoken at 75% of normal speed.
Great English listening and reading practice.
A group of scientists say sea levels are rising at record rates. Another group
found that January temperatures in the Arctic reached a record high. |
Capturing CO2 Gas Is Not Easy
(Beginner - Listening,
reading)
A video lesson to
help with your understanding of climate change.
The English is
spoken at 75% of normal speed.
Great English listening and reading practice.
Most scientists agree that carbon-dioxide gas is partly to blame for climate
change: rising global temperatures. But capturing the CO2 gas released by power
stations is costly and difficult. |
Growth, Climate Change Threaten African Plants and
Animals
(Beginner - Listening,
reading)
A video lesson to
help with your understanding of climate change.
The English is
spoken at 75% of normal speed.
Great English listening and reading practice.
Researchers believe Africa may lose as much as 30 percent of its animal and
plant species by the end of this century. |
|
|
|
|
Search Fun Easy English |
|
|
|
|
|
|
|
|
|
|
|
|
|
|
|
About
Contact
Copyright
Resources
Site Map |