|
|
| |
|
|
| |
|
|
|
|
| |
 Climate Change Indicators: Sea Level Climate Change Indicators: Sea Level
This indicator describes how sea level has changed over
time. The indicator describes two types of sea level
changes: absolute and relative.
Key Points
After a period of approximately 2,000 years of little change
(not shown here), global average sea level rose throughout
the 20th century, and the rate of change has accelerated in
recent years.1 When averaged over all of the world’s oceans,
absolute sea level has risen at an average rate of 0.06
inches per year from 1880 to 2013 (see Figure 1). Since
1993, however, average sea level has risen at a rate of 0.11
to 0.14 inches per year—roughly twice as fast as the
long-term trend.
Relative sea level rose along much of the U.S. coastline
between 1960 and 2015, particularly the Mid-Atlantic coast
and parts of the Gulf coast, where some stations registered
increases of more than 8 inches (see Figure 2). Meanwhile,
relative sea level fell at some locations in Alaska and the
Pacific Northwest. At those sites, even though absolute sea
level has risen, land elevation has risen more rapidly.
While absolute sea level has increased steadily overall,
particularly in recent decades, regional trends vary, and
absolute sea level has decreased in some places.2 Relative
sea level also has not risen uniformly because of regional
and local changes in land movement and long-term changes in
coastal circulation patterns. |
|
Background
As the temperature of the Earth changes, so does sea level.
Temperature and sea level are linked for two main reasons:
Changes in the volume of water and ice on land (namely
glaciers and ice sheets) can increase or decrease the volume
of water in the ocean (see the Glaciers indicator).
As water warms, it expands slightly—an effect that is
cumulative over the entire depth of the oceans (see the
Ocean Heat indicator).
Changing sea levels can affect human activities in coastal
areas. Rising sea level inundates low-lying wetlands and dry
land, erodes shorelines, contributes to coastal flooding,
and increases the flow of salt water into estuaries and
nearby groundwater aquifers. Higher sea level also makes
coastal infrastructure more vulnerable to damage from
storms.
The sea level changes that affect coastal systems involve
more than just expanding oceans, however, because the
Earth’s continents can also rise and fall relative to the
oceans. Land can rise through processes such as sediment
accumulation (the process that built the Mississippi River
delta) and geological uplift (for example, as glaciers melt
and the land below is no longer weighed down by heavy ice).
In other areas, land can sink because of erosion, sediment
compaction, natural subsidence (sinking due to geologic
changes), groundwater withdrawal, or engineering projects
that prevent rivers from naturally depositing sediments
along their banks. Changes in ocean currents such as the
Gulf Stream can also affect sea levels by pushing more water
against some coastlines and pulling it away from others,
raising or lowering sea levels accordingly.
Scientists account for these types of changes by measuring
sea level change in two different ways. Relative sea level
change refers to how the height of the ocean rises or falls
relative to the land at a particular location. In contrast,
absolute sea level change refers to the height of the ocean
surface above the center of the earth, without regard to
whether nearby land is rising or falling. |
|
About the Indicator
This indicator presents trends in sea level based on
measurements from tide gauges and from satellites that orbit
the Earth. Tide gauges measure relative sea level change at
points along the coast, while satellite instruments measure
absolute sea level change over nearly the entire ocean
surface. Many tide gauges have collected data for more than
100 years, while satellites have collected data since the
early 1990s.
Figure 1 shows annual absolute sea level change averaged
over the entire Earth’s ocean surface. The long-term trend
is based on tide gauge data that have been adjusted to show
absolute global trends through calibration with recent
satellite data. This long-term data set has been calculated
through 2013, while satellite data are now available through
the end of 2015. Figure 2 shows trends at a more local
scale, highlighting the 1960 to 2015 change in relative sea
level at 67 tide gauges along the Atlantic, Pacific, and
Gulf coasts of the United States.
Indicator Notes
Relative sea level trends represent a combination of
absolute sea level change and any local land movement. Tide
gauge measurements such as those in Figure 2 generally
cannot distinguish between these two different influences
without an accurate measurement of vertical land motion
nearby.
Some changes in relative and absolute sea level can be due
to multi-year cycles such as El Niño and La Niña, which
affect coastal ocean temperatures, salt content, wind
patterns, atmospheric pressure (and thus storm tracks), and
currents. Obtaining a reliable trend can require many years
of data, which is why the satellite record in Figure 1 has
been supplemented with a longer-term reconstruction based on
tide gauge measurements.
Data Sources
Absolute sea level trends were provided by Australia’s
Commonwealth Scientific and Industrial Research Organisation
and the National Oceanic and Atmospheric Administration.
These data are based on measurements collected by satellites
and tide gauges. Relative sea level data are available from
the National Oceanic and Atmospheric Administration, which
publishes an interactive online map
https://tidesandcurrents.noaa.gov/sltrends/sltrends.shtml
with links to detailed data for each tide gauge.
Technical Documentation
Download related technical information PDF |
|
 Figure
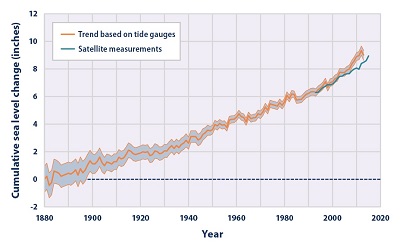
1. Global Average Absolute Sea Level Change,
1880–2015 Figure
1. Global Average Absolute Sea Level Change,
1880–2015
This graph shows cumulative changes in sea level for the
world’s oceans since 1880, based on a combination of
long-term tide gauge measurements and recent satellite
measurements. This figure shows average absolute sea level
change, which refers to the height of the ocean surface,
regardless of whether nearby land is rising or falling.
Satellite data are based solely on measured sea level, while
the long-term tide gauge data include a small correction
factor because the size and shape of the oceans are changing
slowly over time. (On average, the ocean floor has been
gradually sinking since the last Ice Age peak, 20,000 years
ago.) The shaded band shows the likely range of values,
based on the number of measurements collected and the
precision of the methods used.
Data sources: CSIRO, 2015;3 NOAA, 20164 |
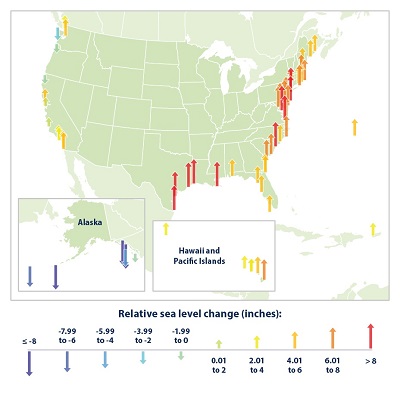 Figure
2. Relative Sea Level Change Along U.S. Coasts,
1960–2015 Figure
2. Relative Sea Level Change Along U.S. Coasts,
1960–2015
This map shows cumulative changes in relative sea level from
1960 to 2015 at tide gauge stations along U.S. coasts.
Relative sea level reflects changes in sea level as well as
land elevation.
Data source: NOAA, 20165 |
|
|
|
EPA Page |
|
This is the
EPA page for this topic. To see if the Trump
administration has changed the EPA page, simply click the
link and compare the information with this page. If you
notice changes were made to the EPA page, please post a
comment. Thanks. |
|
|
|
|
|
|
|
|
|
|
|
|
Additional Climate Change Information |
Climate Change and Carbon Dioxide
(Beginner - Listening,
reading)
A video lesson to
help with your understanding of climate change
and carbon dioxide.
The English is
spoken at 75% of normal speed.
Great English listening and reading practice. |
Carbon Dioxide and Climate Change
(Beginner - Listening,
reading)
A video lesson to
help with your understanding of carbon dioxide
and climate change.
The English is
spoken at 75% of normal speed.
Great English listening and reading practice. |
Environmental Group Warns Earth's Health at Risk
(Beginner - Listening,
reading)
A video lesson to
help with your understanding of climate change.
The English is
spoken at 75% of normal speed.
Great English listening and reading practice.
A report by the World Wildlife Fund looked at thousands of animal populations
and found they have dropped significantly in 40 years. |
Sea Levels Rising at Fastest Rate in 3,000 years
(Beginner - Listening,
reading)
A video lesson to
help with your understanding of climate change.
The English is
spoken at 75% of normal speed.
Great English listening and reading practice.
A group of scientists say sea levels are rising at record rates. Another group
found that January temperatures in the Arctic reached a record high. |
Capturing CO2 Gas Is Not Easy
(Beginner - Listening,
reading)
A video lesson to
help with your understanding of climate change.
The English is
spoken at 75% of normal speed.
Great English listening and reading practice.
Most scientists agree that carbon-dioxide gas is partly to blame for climate
change: rising global temperatures. But capturing the CO2 gas released by power
stations is costly and difficult. |
Growth, Climate Change Threaten African Plants and
Animals
(Beginner - Listening,
reading)
A video lesson to
help with your understanding of climate change.
The English is
spoken at 75% of normal speed.
Great English listening and reading practice.
Researchers believe Africa may lose as much as 30 percent of its animal and
plant species by the end of this century. |
|
|
|
|
Search Fun Easy English |
|
|
|
|
|
|
|
|
|
|
|
|
|
|
|
About
Contact
Copyright
Resources
Site Map |